Bitcoin’s price action has been turbulent, and the chart suggests significant upcoming movements. The digital asset, trading within a Bull Flag, is nearing critical supply and demand regions. Understanding these areas is crucial for traders seeking to capitalize on BTC’s next move.
Current Market Dynamics
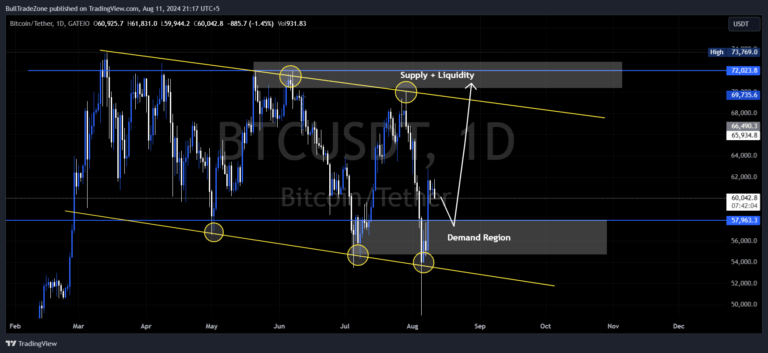
As of now, Bitcoin is priced around $60,042.8, down by approximately 1.45%. The chart indicates that BTC is navigating a Bull Flag, marked by two parallel yellow lines. This channel has been guiding the price since March, with Bitcoin consistently finding resistance at the top and support at the bottom.
Demand Region and Potential Rebound
One of the most noteworthy areas on this chart is the demand region, highlighted between $57,963.3 and $59,000. This zone has acted as a crucial support multiple times since May, as indicated by the yellow circles. Each time Bitcoin dipped into this area, a strong buying response emerged, pushing the price higher.
Given Bitcoin’s current trajectory, it appears that the asset may once again test this demand region. If history is any indication, we could see a significant rebound from this level, potentially offering a lucrative entry point for traders looking to go long.
Supply Zone and Liquidity Target
On the other hand, the supply region, marked between $69,735.6 and $72,023.8, presents a resistance area. The chart shows that Bitcoin has struggled to break through this zone multiple times, as indicated by the yellow circles near the channel’s upper boundary.
This supply zone not only represents resistance but also acts as a liquidity target for institutional players. If Bitcoin manages to rally from the demand region, it could aim for this supply zone, where significant selling pressure is likely to be encountered. Traders should be cautious and consider taking profits as BTC approaches this level.
Trading Strategy
Given the current setup, a potential trading strategy could involve waiting for Bitcoin to test the demand region around $57,963.3. A strong bullish reaction in this area could signal a buying opportunity, with a target set near the supply zone at $72,023.8.
However, traders should keep an eye on any break below the demand region, as this could lead to further downside, invalidating the bullish setup. Conversely, if Bitcoin manages to break above the supply zone with conviction, it could signal the beginning of a new uptrend.
Conclusion
Bitcoin’s price is at a pivotal point, with both supply and demand regions playing a crucial role in determining its next move. Traders should remain vigilant and consider these key levels when planning their trades. Whether BTC will break out of the Bull Flag or continue within its confines remains to be seen, but the upcoming price action will undoubtedly be pivotal for the cryptocurrency’s short to mid-term trajectory.
Join Free Trading group


